Daily activity report
An automatic daily report is available by email and provides an overview of ticket support management activity.
KPIs refer to the previous day and are compared with the same day of the previous week. All times are expressed in minutes.
Requirements
To configure report recipients you must be an administrator.
If your user is a member, ask a room administrator to change your user type (from member to administrator), or contact Quoting24 support.
How to set up the report
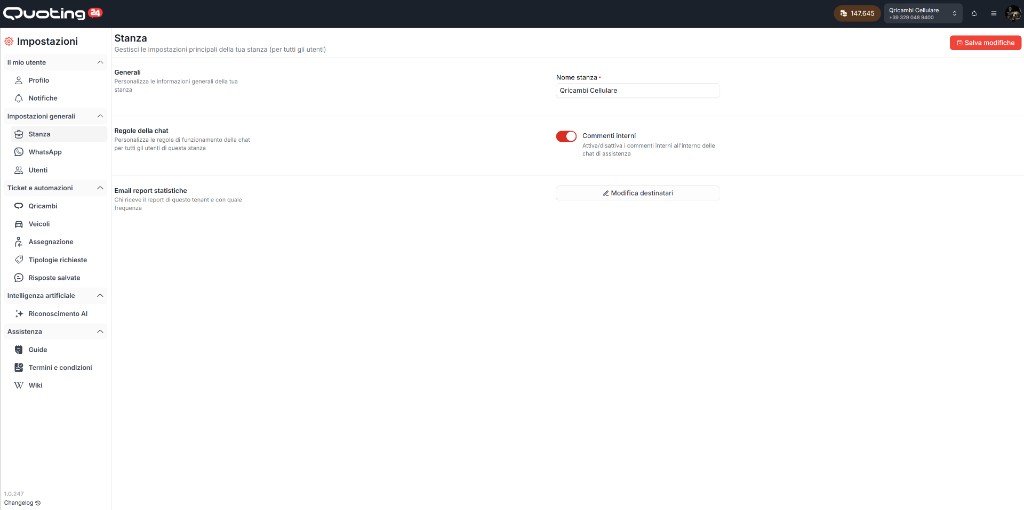
- Open Settings → General settings → Business
- In the Statistics report emails section, click Edit recipients
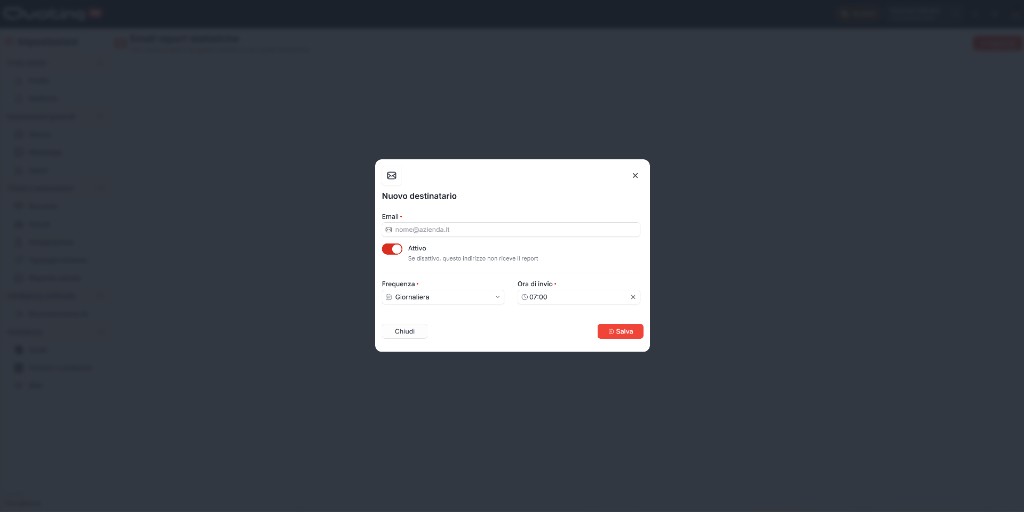
- Add a new recipient and fill in:
- Email of the address that should receive the report
- Active: when off, that address does not receive the report
- Frequency (for example Daily)
- Send time
- Click Save
What the report contains
Yesterday’s KPIs
Main indicators for the previous day, with comparison to the same day of the previous week:
- tickets created and tickets closed
- closure percentage
- replies sent by operators
- messages received
- median response time
- median ticket opening time
- active operators
- active contacts
- vehicles searched
- spare parts requests made
Operator performance
Detail for each operator on:
- replies sent
- internal notes
- assigned and closed tickets
- closure percentage
- median response and opening time
Messages by time slot
Distribution of messages received and sent during the day, split by time slot (local time). Internal notes and deleted messages are excluded.
Online users
Number of different operators who worked in each time slot (ticket events, messages or notes sent).
Open tickets
Trend of tickets in open status throughout the day (periodic samples), including the peak and how many are still open at end of day. Also counts tickets created on previous days if still open.
Top customers
List of customers with the most activity that day, ordered by messages received, with details on vehicles, searches, messages and involved operators.
Daily trend
Comparison between the current and previous week: tickets created and operator replies day by day.
Last 7 days statistics
- Aggregated operator performance over the last 7 days
- Activity heatmap, which highlights each operator’s replies day by day
This report helps you monitor customer service efficiency, analyze workloads and evaluate performance trends over time.